Welcome to CDP's global website
Please select the site for your country / region to view the most suitable information
Corporate Environmental Action Tracker Methodology
Methodology sections
Overview
The Corporate Environmental Action Tracker (CEAT) shows, at an aggregated level, the status of action on climate by companies disclosing through CDP.
The tracker gives companies, capital markets, policymakers and civil society access to insights from the world’s largest environmental data set to help inform decisions and understand corporate progress towards and potential impact of current commitments disclosed through CDP.
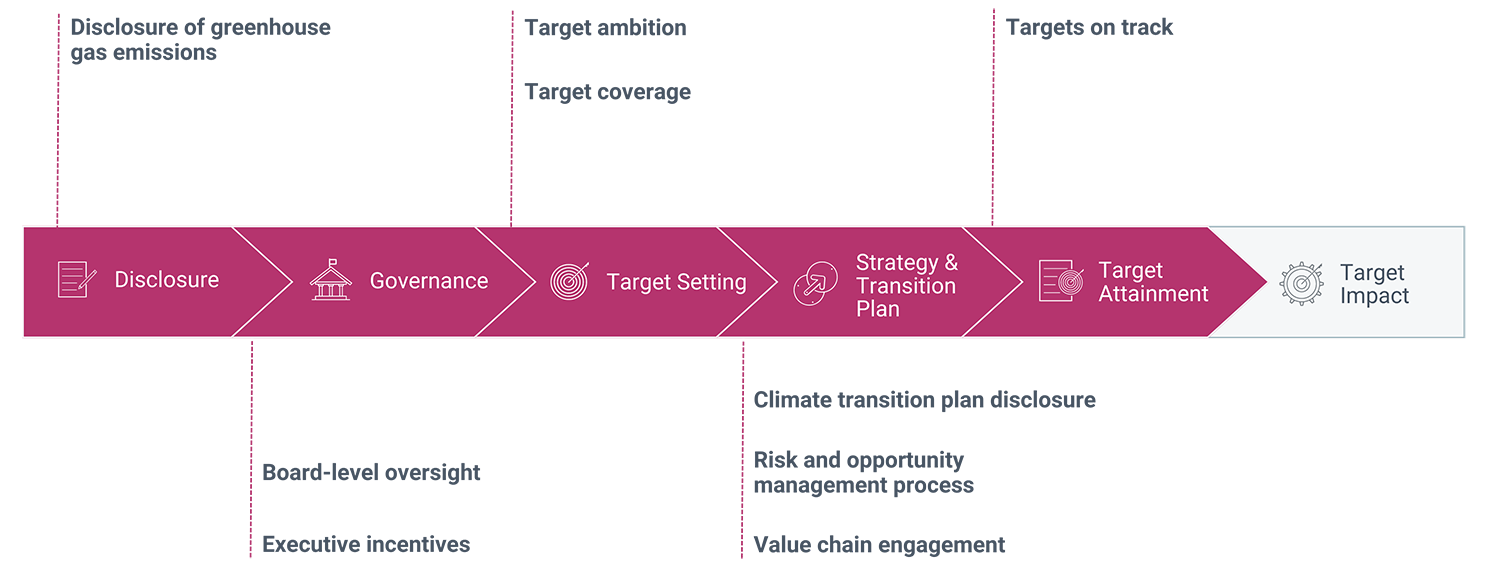
The tracker is organized in six steps, which represent a company’s transition journey: Disclosure, Governance, Target Setting, Transition Plan & Strategy, Target Attainment and Target Impact.
Each step contains indicators used to measure progress.
![]()
Results are shown per reporting year and are based on all responses from one disclosure cycle[1].
For each indicator, the current status of action can be viewed at different aggregation levels:
- Global: Shows results aggregated across all companies.
- Country/area: Shows results aggregated across countries and areas, from companies’ country-level disclosures (Disclosure step only).
- Sector: Shows results aggregated across companies by given sectors.
- Index: Shows results aggregated across the companies that were part of the FTSE 100 and S&P 500 indices in the reporting year.
| Level | Step | Disclosure | Governance | Target Setting | Strategy & Transition Plan | Target Attainment | Target Impact |
| Global |
|
|
|
|||
| Country/Area | ||||||
| Sector | ||||||
| Index |
To measure progress on reducing emissions, a useful value is the proportion of total emissions[2] which comes from companies taking a specific action on climate. This is why most indicators in the tracker, namely all indicators in Steps 1 to 5 at Global and Sector level, are shown in this metric. For additional information, we also show the absolute emissions for these indicators.
For the country level in the Disclosure step, the proportion of each country/area's emissions covered by CDP are presented in terms of five categories representing the level of coverage within each country/area, as the uncertainties at that aggregation level are much higher.
The only level at which indicators are shown in a different metric is the Index level, where the total emissions of all companies in the index is not necessarily known, if not all companies disclose their emissions. Here we use number and revenue-based metrics.
All companies disclosing through CDP are in principle considered in the aggregation, with a few nuances:
- For number-based aggregations (Index level only) all companies are included.
- For revenue-based aggregations (Index level only) all companies for which revenue data could be obtained are included[3].
- For emissions-based aggregations (Global, Country and Sector level) we filtered out companies based on the robustness of their disclosed emissions values, to ensure a robust result of aggregation. This filtering process is described in more detail below.
The indicators are shown at Global and Sector level in terms of absolute emissions (aggregated emissions of all companies in a given category) as well as percentage emissions. We show two different aggregation results:
- Aggregation of Scope 1 emissions only. This is the value shown in the graphs in Steps 1 to 5. We use the Scope 1 aggregated values as our main values throughout the tracker as these are direct emissions from companies that can be compared to the total global or sector emissions without the risk of double-counting.
- Aggregation of Scope 1 and 2 emissions. These values are only given in the information tooltips that appear upon hovering on emissions charts. Aggregation of Scope 1 and Scope 2 emissions provides a more complete picture of companies' footprint, especially at sectoral level.
Note: At global level, aggregate values including Scope 2 are often smaller than Scope 1 only as the companies in the power & heat sector are excluded from this aggregation to avoid double counting with the other sectors’ Scope 2 emissions.
At Index level, the indicators are shown in terms of the number of companies as well as share of index of revenue.
The results in the tracker are based on the responses from companies to CDP’s climate change questionnaire[4].
Where we express the results as a percentage, eg proportion of global emissions, we use a value for total emissions derived from a combination of various external data sources. These total values serve as reference for the percentage metrics and are derived as follows:
Global:
- For the global level, we use total global emissions in the reporting year, based on an aggregation of countries’ emissions inventories, taken from PRIMAP, and including an estimate of bunker emissions from Climate Watch.
Sector:
- The emissions from national inventories, summed to the global level, are combined with estimates from Climate Watch to yield a total of six sectors, which are then used as the basis for the percentage metrics at sector level.
- The national inventory emissions are taken from PRIMAP at the following aggregation level: Energy, Industrial Process emissions, Agriculture, Waste.
- The Energy values are further subdivided using Climate Watch estimates to yield global total emissions for Power/Heat, Buildings & Transport and Industry.
- The resulting inventory sectors are mapped to CDP’s Activity Classification System (CDP-ACS) to enable a mapping of each company to a single sector on the tracker.
- While we are aware of uncertainties introduced by mapping all of the emissions of a company to one inventory sector, we believe these uncertainties to be relatively small. In future, we hope to be able to more accurately differentiate emissions from companies operating in multiple sectors.
| CEAT Sector | CEAT description | CDP-ACS Industry | CDP-ASC Activity Group(s) |
| Power & heat | All power and heat generation as well as infrastructure supporting their distribution | Power generation | [all] |
| Infrastructure | Energy utility networks | ||
| Industry | All extractive and manufacturing industries, including construction and food processing | Apparel | [all] |
| Biotech, health care & pharma | [all] | ||
| Food, beverage & agriculture | Food & beverage processing | ||
| Fossil Fuels | [all] | ||
| Infrastructure | Construction | ||
| Manufacturing | [all] | ||
| Materials | [all] | ||
|
Retail & services (incl. transport) |
Retail and all services, including rail and road transport and real estate ownership and development | Hospitality | [all] |
| Infrastructure | Land & property ownership & development | ||
| Retail | [all] | ||
| Services | [all] | ||
| International bodies | [all] | ||
| Transportation services | Intermodal transport & logistics | ||
| Transportation services | Rail transport | ||
| Transportation services | Road transport | ||
| Aviation & shipping | Air and marine transport | Transportation services | Air transport |
| Transportation services | Marine transport | ||
| Agriculture | Crop, fish and animal farming | Food, beverage & agriculture | Crop farming |
| Food, beverage & agriculture | Fish & animal farming | ||
| Waste | Waste (including waste water) management and recycling | Infrastructure | Non-energy utilities |
Index:
- For the index level, we use the total number of companies and their total combined revenue in USD to derive the percentage metrics.
Indicators
Each indicator is designed to assess climate action, based on corporate disclosure. In the tracker we differentiate between category-based indicators in Steps 1‒5 and the impact indicators of Step 6.
Steps 1‒5: Category indicators
For each indicator, each company is assigned a single category, based on their responses to certain questions, or combinations of questions, in the questionnaire.
The companies are then aggregated in their categories.
Example:
For the indicator Value chain engagement in Step 4: Strategy and Transition Plan, we have defined five possible categories:
- Engaging with suppliers and customers
- Engaging with suppliers only
- Engaging with customer only
- No engagement
- Limited data
These five categories are mapped to the answers to question C12.1 of the CDP climate change questionnaire[4] “Do you engage with your value chain on climate-related issues?” (see the detailed section on the Value chain indicator for details on this mapping). Every company is assigned to one of the five categories above.
In the 2023 disclosure cycle, shown as reporting year 2022 on the tracker, the following numbers of companies were assigned to each bucket. As the indicator is mainly shown in terms of the emissions of the companies contained in these buckets (rather than the number of companies), only companies that passed the emissions filtering step are included.
| Category | Mt CO2e | # companies |
| Suppliers and customers | ~5,700 | ~4,800 |
| Suppliers only | ~1,400 | ~1,800 |
| Customers only | ~1,300 | ~2,600 |
| Not engaging | ~600 | ~2,900 |
| Limited data | ~40 | ~260 |
| Total | ~9,000 | ~12,300 |
The following sections explain how the category values at company-level were derived for each indicator.
Disclosure of greenhouse gas emissions (Global, Sector, Index)
Two categories are shown for the disclosure indicator at Global, Sector and Index level.
| Categories | Disclosed | Not disclosed |
|---|
Any company reporting emissions through CDP is given the ‘Disclosed’ category if they passed the filtering process. This is based on the answers to these questions in the CDP climate change questionnaire[4]:
- C6.1: “What were your organization’s gross global Scope 1 emissions in metric tons CO2e?”
- C6.3: “What were your organization's gross global Scope 2 emissions in metric tons CO2e?”
The ‘not disclosed’ category represents our estimate of the total global/sectoral emissions that are not covered by companies currently reporting through CDP. This is the only category in the whole tracker that is based entirely on external data sources. It includes companies not (yet) disclosing through CDP, as well as non-corporate actors, such as private individuals and public institutions. The two categories ("disclosed" and "not disclosed") add up to the total global/sectoral emissions.
Disclosure of greenhouse gas emissions (Country)
| Categories | Extensive reach | Good reach | Significant reach | Moderate coverage | Low coverage | Limited data |
|---|---|---|---|---|---|---|
| Equivalent to country emissions coverage | over 75% | 51–75% | 26–50% | 11–25% | 1–10% | 0% |
For the country-level disclosure coverage, we use the country-level emissions from those companies that provided country/area breakdown of their emissions, using responses from the following questions[4]:
- C7.2: “Break down your total gross global Scope 1 emissions by country/region.”
- C7.5: “Break down your total gross global Scope 2 emissions by country/region.”
We then aggregate the emissions across countries and compare with the country’s inventory emissions for the reporting year. Countries are assigned a category based on the share of their emissions that companies have reported on in their country-level reporting.
Countries need to have emissions reported from at least 20 companies to have their data displayed, otherwise they are given the ‘Limited data’ category.
Board-level oversight
We have defined five categories for this indicator across all levels.
| Categories | Board-level oversight & C-suite responsibility | Board-level oversight and below C-suite responsibility | C-suite responsibility only | No board-level oversight or C-suite responsibility | Limited data |
|---|
The categories are based on a combination of answers to two questions in the CDP climate change questionnaire[4]:
- C1.1: “Is there board-level oversight of climate-related issues within your organization?”
- C1.2: “Provide the highest management-level position(s) or committee(s) with responsibility for climate-related issues.”
Executive incentives
We have defined five categories for this indicator across all levels
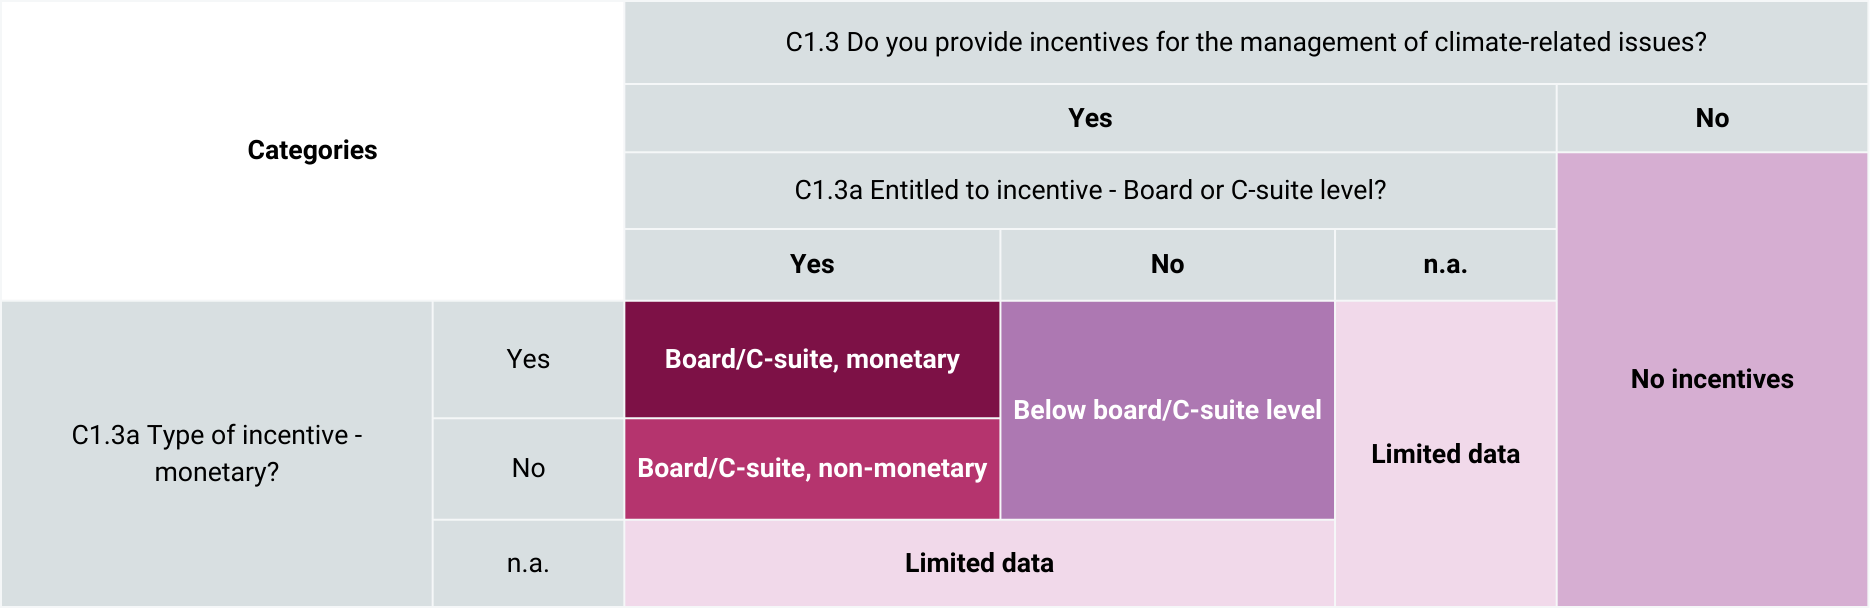
The categories are based on a combination of answers to question C1.3 and C1.3a in the CDP climate change questionnaire[4].
- C1.3: “Do you provide incentives for the management of climate-related issues [..]?”
- C1.3a: “Provide [..] details on the incentives provided for the management of climate-related issues [..].”
C1.3a allows multiple responses per organization, with each response representing an incentive with its properties. Respondents can specify which level in the organization is incentivized, which informs the Board/C-suite component of our category. They can also specify whether incentives are monetary in nature or not.
Target ambition
We have defined five categories for this indicator across all levels.
| Categories | SBTi 1.5°C | SBTi 2°C/well-below 2°C | Other target | No target | Limited data |
|---|
For information on whether or not the organization has a target, we look at the target setting question in the questionnaire[4]:
- C4.1: “Did you have an emissions target that was active in the reporting year?”
For all organizations that disclose having an active emissions target and fully provided details for their targets in C4.1a and/or C4.1b, we review the Science Based Targets initiative (SBTi) list of approved targets and corresponding approval dates. If the organization submitted at least one target in the questionnaire for that year and their SBTi approval date precedes the end of the questionnaire reporting period, we give the company a category based on the strength of their current approved SBTi target. However, if the organization answered ‘No’ to C4.1 or answered ‘Yes’ but then did not provide further details on the target in questions C4.1a or C4.1b, we consider this an incomplete response and set their category to ‘No target’. Note that for the aggregation, all Scope 1 / 2 emissions of the company are taken into account, irrespective of the emissions coverage of individual targets. The SBTi requires approved targets to cover at least 95% of combined Scope 1 and 2 company-wide emissions.
Target coverage
We have defined four categories for this indicator across all levels.
| Categories | Targets incl. Scope 3 | Targets excl. Scope 3 | No target | Limited data |
|---|
For this indicator we look at all absolute and intensity-based emissions targets of an organization and check whether any target covers Scope 3 emissions. This results in a category at company level (across all targets).
The information is taken from the target setting questions in the questionnaire[4], namely:
- C4.1a: “Provide details of your absolute emissions target(s) and progress made against those targets.”
- C4.1b: “Provide details of your emissions intensity target(s) and progress made against those target(s).”
Note that for the aggregation, all Scope 1 / 2 emissions of the company are taken into account, irrespective of the emissions coverage of individual targets.
Climate transition plan disclosure
We have defined five categories for this indicator across all levels.
| Categories | All (100%) | Many (67–99%) | Some (34–66%) | Few (0–33%) | Limited data |
|---|
This indicator displays results from CDP’s Climate Transition Plan disclosure analysis, which has been published annually since the 2021 disclosure cycle.
The indicator is a measure of the completeness of a company’s transition plan disclosure.
The categories show the proportion of key indicators of a credible climate transition plan that the company disclosed information to in that year’s disclosure. A total of 21 indicators are assessed. A score of 50% indicates that the organization submitted a response to questions covering at least 11 of the 21 key indicators.
Further information about our Climate Transition Plan analysis can be found here.
Risk and opportunity management process
We have defined five categories for this indicator across all levels.
| Categories | Comprehensive or nearly comprehensive process | Process with a few gaps | Process with multiple gaps | No risk/opportunity management process | Limited data |
|---|
The categories are based on a combination of answers to these two questions in the CDP climate change questionnaire[4]:
- C2.1: “Does your organization have a process for identifying, assessing, and responding to climate-related risks and opportunities?”
- C2.2: “Describe your process(es) for identifying, assessing and responding to climate-related risks and opportunities.”
For C2.2 the respondents can specify multiple processes and for each process submit several properties, such as the time horizon(s) the process covers, the value chain stages it covers and the frequency with which it occurs.
The answer to C2.1 (Yes/No) determines the applicability of the category ‘No risk/opportunity management process’ vs ‘Limited data’ in the case of a missing response in C2.2. The other three categories are based on a 2x2 mapping of possible responses to C2.2 on the dimensions of time horizons covered and value chain stages covered.
| C2.2 Time horizons covered?
2–3 (Short, Medium, Long) |
C2.2 Time horizons covered?
0–1 (Short, Medium, Long) |
|
|---|---|---|
| C2.2 # of value chain stages covered?
3 (Direct, Up, Down) |
Comprehensive or nearly comprehensive process | Process with a few gaps |
| C2.2 # of value chain stages covered? <3 |
Process with a few gaps | Process with multiple gaps |
| C2.1 Risks & Opps process in place? No |
No risk/opportunity management process | |
Value chain engagement
We have defined five categories for this indicator across all levels.
| Categories | Suppliers and customers | Suppliers only | Customers only | Not engaging | Limited data |
|---|
The categories are derived directly from the answers to question C12.1 in the CDP climate change questionnaire[4]. The question reads:
- C12.1: “Do you engage with your value chain on climate-related issues?”
The answer “Yes, our investee companies”, which only appears for Financial Services institutions, is mapped to the ‘Customers’ categories.
Targets on track
We have defined five categories for this indicator across all levels.
| Categories | On track | Almost on track | Not on track | Limited data | No target |
|---|
This indicator differs from the others as it is not based on a direct mapping of questionnaire answers to indicator categories. Rather, it follows from an analysis of the organization’s submitted absolute emissions target(s) and their most recent year emissions.
The information is taken from the absolute target setting question in the questionnaire[4], namely:
- C4.1a: “Provide details of your absolute emissions target(s) and progress made against those targets.”
The expected emissions under target for the most recent reporting year are calculated based on an assumption of a linear reduction path between base year and target year. These expected emissions are then compared to the actual emissions in the reporting year.
For this analysis, we have chosen to compare actual emissions to an expected, linear reduction path in the absence of year-by-year target information. In practice, companies may foresee non-linear paths: some may plan greater reductions at first, reaping ‘quick wins’, then slowing down later, others may need time to put measures in place and see steeper reductions in later years. Note that where companies did provide intermediate target year information (for the same target, ie same base year and scope definition), we have taken this into account, ie we have only assumed linear paths between the individual interim target points.
The categories are then assigned as follows.
| Category | Definition |
|---|---|
| On track | Actual emissions in the most recent reporting year are below expected emissions under the stated target on a linear reduction path. |
| Almost on track | Actual emissions in the most recent reporting year are at most one year behind the emissions reduction under a linear reduction path. |
| Not on track | Actual emissions in the most recent reporting year are higher than expected for the year prior to the most recent year, under a linear reduction path. |
| Limited data | Organizations have targets, but the information about the targets is incomplete or inconsistent and did not allow calculation of target attainment as above. Typical reasons for incomplete / inconsistent data include: Targets covering < 75% of company emissions*, target years before or equal to base years, missing base year emissions, missing target scopes. |
| No target | Organizations without targets. |
*We filter out targets which do not cover total emissions in scope because it is not known why the remaining emissions were excluded and it is possible that emissions in the excluded part behave very differently from the emissions under target, potentially significantly offsetting emissions reductions. To avoid excluding too many targets we set this threshold for exclusion slightly below 100%, in this case 75%.
Step 6: Impact indicators
The impact indicators are different from category indicators as they show expected total emissions for future years (up to 2050) informed by the companies’ stated targeted reduction paths.
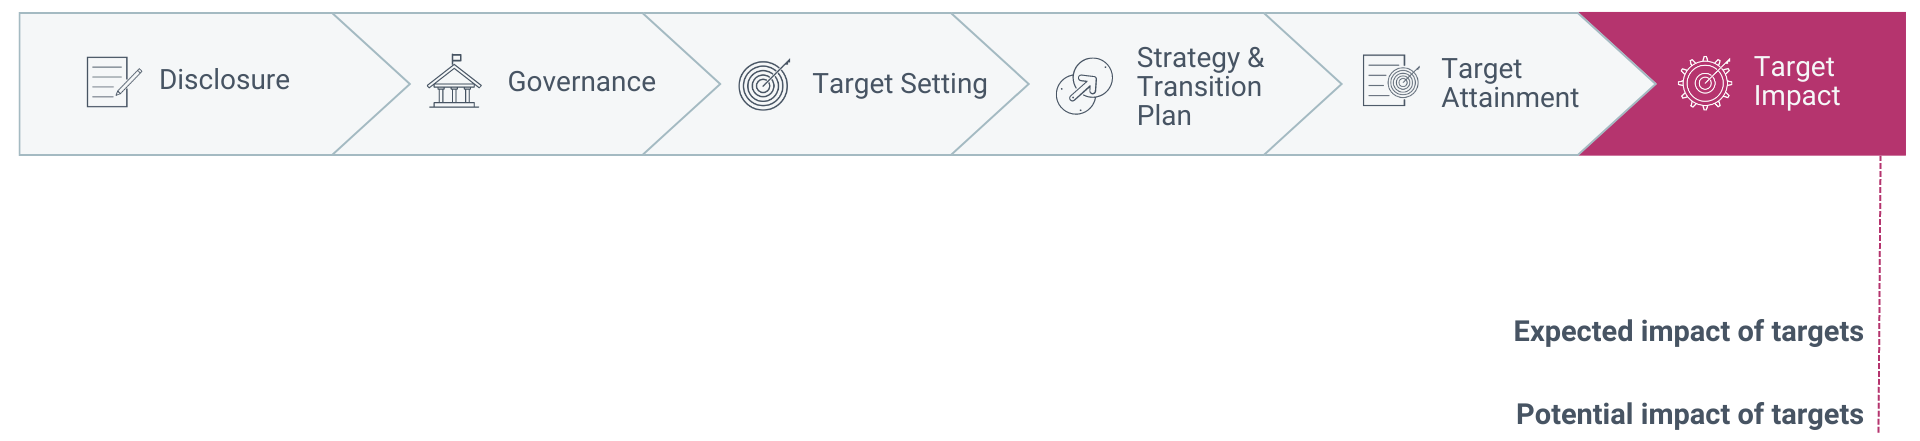
The Expected Impact indicator shows the total aggregated emissions when adding up the expected emissions trajectories of all disclosing companies at a given level (global or sector).
The company emissions trajectories are based on absolute targets (as opposed to intensity-based targets). The information is taken from the absolute target setting question in the questionnaire[4], namely:
- C4.1a: “Provide details of your absolute emissions target(s) and progress made against those targets.”
Only targets that had not been achieved yet and had target years in the future (of the reporting year) are included in the aggregation. Also, similar to the ‘Targets on track’ indicator, targets with incomplete or inconsistent information are excluded. In addition, because a robust split of emissions across scopes was required for aggregation, targets with inconsistent emissions at the scope level are excluded.
Similar to the approach for the ‘Targets on track’ indicator, where only a single base and target year are known, a linear reduction path is assumed. For multiple phase targets, each distinct target year to the next is assumed to be on a separate linear path.
The Potential Impact indicator shows what emissions reductions could be achieved if the total global (or sectoral) emissions were under the same targets as those set by companies disclosing through CDP (and included in our Expected Impact indicator). This means that the emissions for a given future year at the global/sector level are calculated based on:
- the total emissions in the most recent reporting year and
- a reduction percentage for the future year – where that reduction percentage is equal to the weighted average targeted reduction by the disclosing companies for that year (also relative to the most recent reporting year).
Since we always use total emissions, not just total corporate emissions, as the reference for our global and sectoral emission indicators, we also used these total emissions as the starting point for this indicator. To achieve these pathways, all corporate actors globally would have to set (and meet) targets like the companies whose targets are shown in the Expected Impact indicator. In addition, similar reductions would also have to be achieved from non-corporate actors.
For the global level we also show a benchmark pathway, to help the viewer understand how fast global emissions would need to reduce to avoid breaching the 1.5°C limit. This benchmark is based on the reduction rates in the SBTi’s cross-sector pathway. Since the SBTi cross-sector pathway excludes the agriculture and waste sectors, amongst others, the benchmark essentially assumes that these sectors reduce at the same rate as the cross-sector pathway. As the SBTi pathways are updated, the benchmarks shown here will also be reviewed and revised.
Data preparation
Emissions filtering process
We applied different filtering steps to the emissions per company, which formed the basis for all category-based indicators at Global, Country and Sector level. The purpose of the filtering process was to remove potential incorrectly reported emissions values from the aggregation and submissions for very different reporting periods, which could reduce the accuracy of the final result.
The following steps were applied:
- Companies whose emissions were being reported for a period two years or more before the disclosure year were filtered out (eg companies reporting for calendar year 2018 in the 2021 disclosure cycle).
- Companies reporting emissions values above 500 Mt CO2e were filtered out.
- Emissions from larger companies undergo a rigorous cleaning process as outlined in the Full GHG Emissions Dataset methodology, in which unusual emissions values are flagged and checked against annual reports or for unit conversion errors.
- We use the resulting emissions from this cleaning process.
- These companies do not go through the cleaning process of the Full GHG Emissions Dataset.
- As a precaution, companies were filtered out if their submitted emissions values looked unusual, eg
- If the exact same value was submitted in the Scope 1 and Scope 2 emissions fields.
- If emissions larger than 200 Mt CO2e were submitted.
- If emissions larger than 10 Mt CO2e were submitted without third party verification declarations.
External sources
In addition to CDP questionnaire responses and information on company targets from SBTi, we used the following data sources to calculate the indicators:
PRIMAP hist (Potsdam Realtime Integrated Model for probabilistic Assessment of emissions Paths):
- Comprehensive dataset on the historical GHG emissions per country combining a range of sources.
- All emissions-based percentage indicators use PRIMAP emissions values in the (Total Kyoto GHG excluding LULUCF) in denominator.
- Gütschow, J.; Pflüger, M. (2023): The PRIMAP-hist national historical emissions time series v2.5 (1750-2022). zenodo. doi:10.5281/zenodo.10006301.
- See also: Gütschow, J.; Jeffery, L.; Gieseke, R.; Gebel, R.; Stevens, D.; Krapp, M.; Rocha, M. (2016): The PRIMAP-hist national historical emissions time series, Earth Syst. Sci. Data, 8, 571-603, doi:10.5194/essd-8-571-2016
- Obtained via Climate Watch Historical GHG Emissions Data Explorer; accessed 17 December 2023.
Climate Watch:
- We use the Climate Watch dataset to split the PRIMAP data on Energy by (sub)sector and to add estimates for aviation and shipping emissions which are excluded from the PRIMAP data
- Climate Watch Historical GHG Emissions. 2022. Washington, DC: World Resources Institute. Available online at: www.climatewatchdata.org/ghg-emissions
- Accessed 13 May 2023.
Bloomberg (2019-2022):
- Revenue values were collected:
- per disclosing company for the end of their reporting period
- for the full index (FTSE 100 and S&P 500) for 1 September of the reporting year
- Bloomberg Finance L.P.
- Accessed Sep 2019, Oct 2020, Nov 2021, Sep 2022
SBTi – Science Based Targets Initiative:
- The target ambition indicator ‘Potential Impact’ shows a comparison of expected global emissions under targets with a global emissions benchmark consistent with respecting the 1.5°C temperature limit. That benchmark is derived from the SBTi’s 1.5°C cross-sector pathway
- More information on SBTI: sciencebasedtargets.org/companies-taking-action
- Detailed information on how the SBTi benchmark was calculated: Pathways to Net-Zero report (2021)
bp Statistical Review of World Energy – GHG emissions for key countries / regions:
- We may use the bp dataset in future to extend PRIMAP data on total emissions per country and globally to the latest reporting year as needed, depending on publication dates.
- www.bp.com/en/global/corporate/energy-economics/statistical-review-of-world-energy/co2-emissions.html
Acknowledgements
Methodology, analysis and narrative created in collaboration with 7Gen GmbH and AG Climate & Energy Ltd.
FAQ
Use the detailed screens to see the data over time. The first year we have analysis for is 2019 (reporting year).
In principle, yes. However, to aggregate across companies a robust value in the aggregation metric was required for the company to be ‘counted’. This means that companies which did not pass the emissions filtering process are currently not included in the Global, Country and Sector emissions-based metrics.
Additional filtering was done for the attainment and impact indicators in Steps 5 and 6. Since we needed several inputs per target to be able to robustly define the expected emissions path per company, we had to filter out companies’ targets if:
- They missed basic information, eg target year or base year definition or base year emissions values.
- Targets of unclear impact, eg where target year equaled or preceded base year or where the target covered less than 75% of total emissions in scope.
Additional filtering steps were applied to Step 6: Target Impact, where we removed targets if:
- They were targets which were not expected to contribute to future impact, eg targets whose target years had passed, or which were labelled expired, achieved, or retired.
- Targets with inconsistent information, eg where base year emissions per scope did not sum up to total base year emissions.
Although the tracker contains these values (in the interactive tooltips and the full data download file), for the visualizations we have chosen to represent companies by their emissions, to give adequate weighting to larger / more heavily emitting companies in the overall values.
We may add additional metrics in the future.
Aggregated Scope 1 values are the main values displayed in all emissions-based graphs in the tracker. Aggregation taking into account Scope 2 emissions as well are shown in the tool tips which appear when hovering with the cursor over an emissions graph data point.
Scope 3 emissions are excluded in the tracker. Scope 3 emissions are essential to understanding the full footprint of an individual organization. In the tracker we do not show individual organizations, but aggregations. Scope 3 emissions need to be excluded from these aggregations to avoid double counting, or an estimate would have to be made of the extent of overlap.
We do, however, include one indicator which shows the extent to which companies’ targets include Scope 3 emissions in Step 3 on Target Setting.
There are several reasons for this discrepancy:
- In Step 3, we show the total emissions (in Scope 1 and/or 2) from companies that have set targets, irrespective of whether the targets fully cover these scopes.
- In Step 6, we show the actual emissions covered by targets. Since some companies set targets only for part of their emissions, and we have completely removed targets that cover less than 75% of total emissions in scope (see exclusion process for attainment indicator), this will be a smaller value than the total emissions from these companies.
- In addition, we also had to remove targets with insufficient/incomplete information for Step 6, which further reduces this value.
The graph on the Disclosure Global page shows the total number of companies which were used in any of the aggregations. Since there are a small number of companies which were not included in the emissions aggregations (see filtering process), but are part of the Indices and thus figure in the number and/or revenue-based calculations, the numbers can differ slightly.
Glossary
Level: We show data at four different levels in the tracker: Global, Country, Sector, Index. The country-level results only exist for the disclosure indicator on Step 1.
MtCO2e Megatonnes (106 metric tonnes) of carbon dioxide equivalent (i.e. including several/all greenhouse gases, rebased according to their global warming potential)
Reporting year: The year shown on the tracker. This is the calendar year preceding the questionnaire/disclosure year which the analysis is based on. For example, the data shown as reporting year 2021 derived from questionnaire responses from the 2022 disclosure cycle.
Sector: Sectors in the Tracker, to the extent possible, are based on the IPCC Common Reporting Framework used by the UNFCCC. However, several datasets had to be combined to allow better matching of the national inventories with the corporate inventory data reported through CDP. See Where does the data in the tracker come from? for more information on the sector definitions. The sectoral emissions, and their aggregation, are used to calculate the proportion of total emissions globally/per sector disclosed through CDP.
Footnotes
1. Note that although all companies’ responses received by 1 October in the disclosure cycle are in principle considered, the emissions indicators only contain responses from companies that report for an accounting year no more than 2 years preceding the disclosure cycle and which pass the emissions filtering process.
2. ‘Total emissions’ here refers to companies’ Scope 1 emissions only. Aggregated Scope 1 values are the main values displayed in all emissions-based graphs in the tracker. Aggregation taking into account Scope 2 emissions as well are shown in the tool tips which appear when hovering with the cursor over an emissions graph data point.
3. In 2022, the revenue data for five FTSE 100 companies and one S&P 500 company could not be obtained, and therefore they had to be excluded from all analyses based on revenue shares.
4. The question numbers quoted in the methodology can be found in the 2020–2023 climate questionnaires.